My website’s blog has been out of commission for the last several years, mainly because the kind of commentary I would do on my blog shifted to Twitter or X. However, I’d like to resurrect it in 2025: not for any serious commentary, but primarily for announcements, recent events, and a little personality. So, I thought it would be fun to do a recap of some highlights from 2024:
Writing & Presenting
This was a pretty successful year for writing. I had 4 essays in Law & Liberty, 2 op-eds in Deseret News, and one journal article in Interpreter. You can find links to them all in the “Writing” section of my website.
I was also invited by USU’s Patrick Mason to contribute a chapter to a volume on Latter Day Saint history. It will discuss how “Mormonism” was used by pro-slavery intellectual George Fitzhugh as a means of arguing against Northern liberalism. In short, Fitzhugh believed that Mormonism’s emergence from the North was evidence of the unnatural culture of Northern liberalism. It will be an expansion of my Law & Liberty piece on the same topic. The chapter was submitted last summer and we should (hopefully) see it in print through University of Illinois Press sometime this year.
I also finalized another chapter for a different volume on…wait for it…James Bond and religion. This will be part of Rowman & Littlefield’s Theology, Religion, and Pop Culture series. I’m a huge James Bond fan and have been since I was a kid, so I jumped at the chance to write on two topics that are so close to my heart. My co-author Guy Burnett and I argue that the James Bond of the novels is a reflection of the 20th-century post-Christian West. Sounds like a stretch, I know, but just wait until you read it. We’re hoping to see it in print at the end of 2025 or early 2026.
I’m nearing the completion of my book on the pro-sociality of markets. I’ve been working on this the last couple of years and I hope to have it completed by the end of the month or mid-February. Most of my Law & Liberty essays from this past year were partially lifted from the book. There’s some interest in the manuscript from a publisher, but I’ll just leave it at that. Don’t want to jinx it!
Finally, I presented at the Mercatus Center’s Markets & Society Conference. My presentation was titled “‘A Pacific System': Peace, Markets, and Doux Commerce.” I argued that economic centralization leads to greater state-on-citizen violence as well as citizen-on-citizen violence. You can see the slides here.
Professional
The most recent professional change came at the end of 2024: I was officially offered an online adjunct faculty gig at Brigham Young University-Idaho. I’ll be teaching international business during the Winter 2025 semester. Excited for this new opportunity!
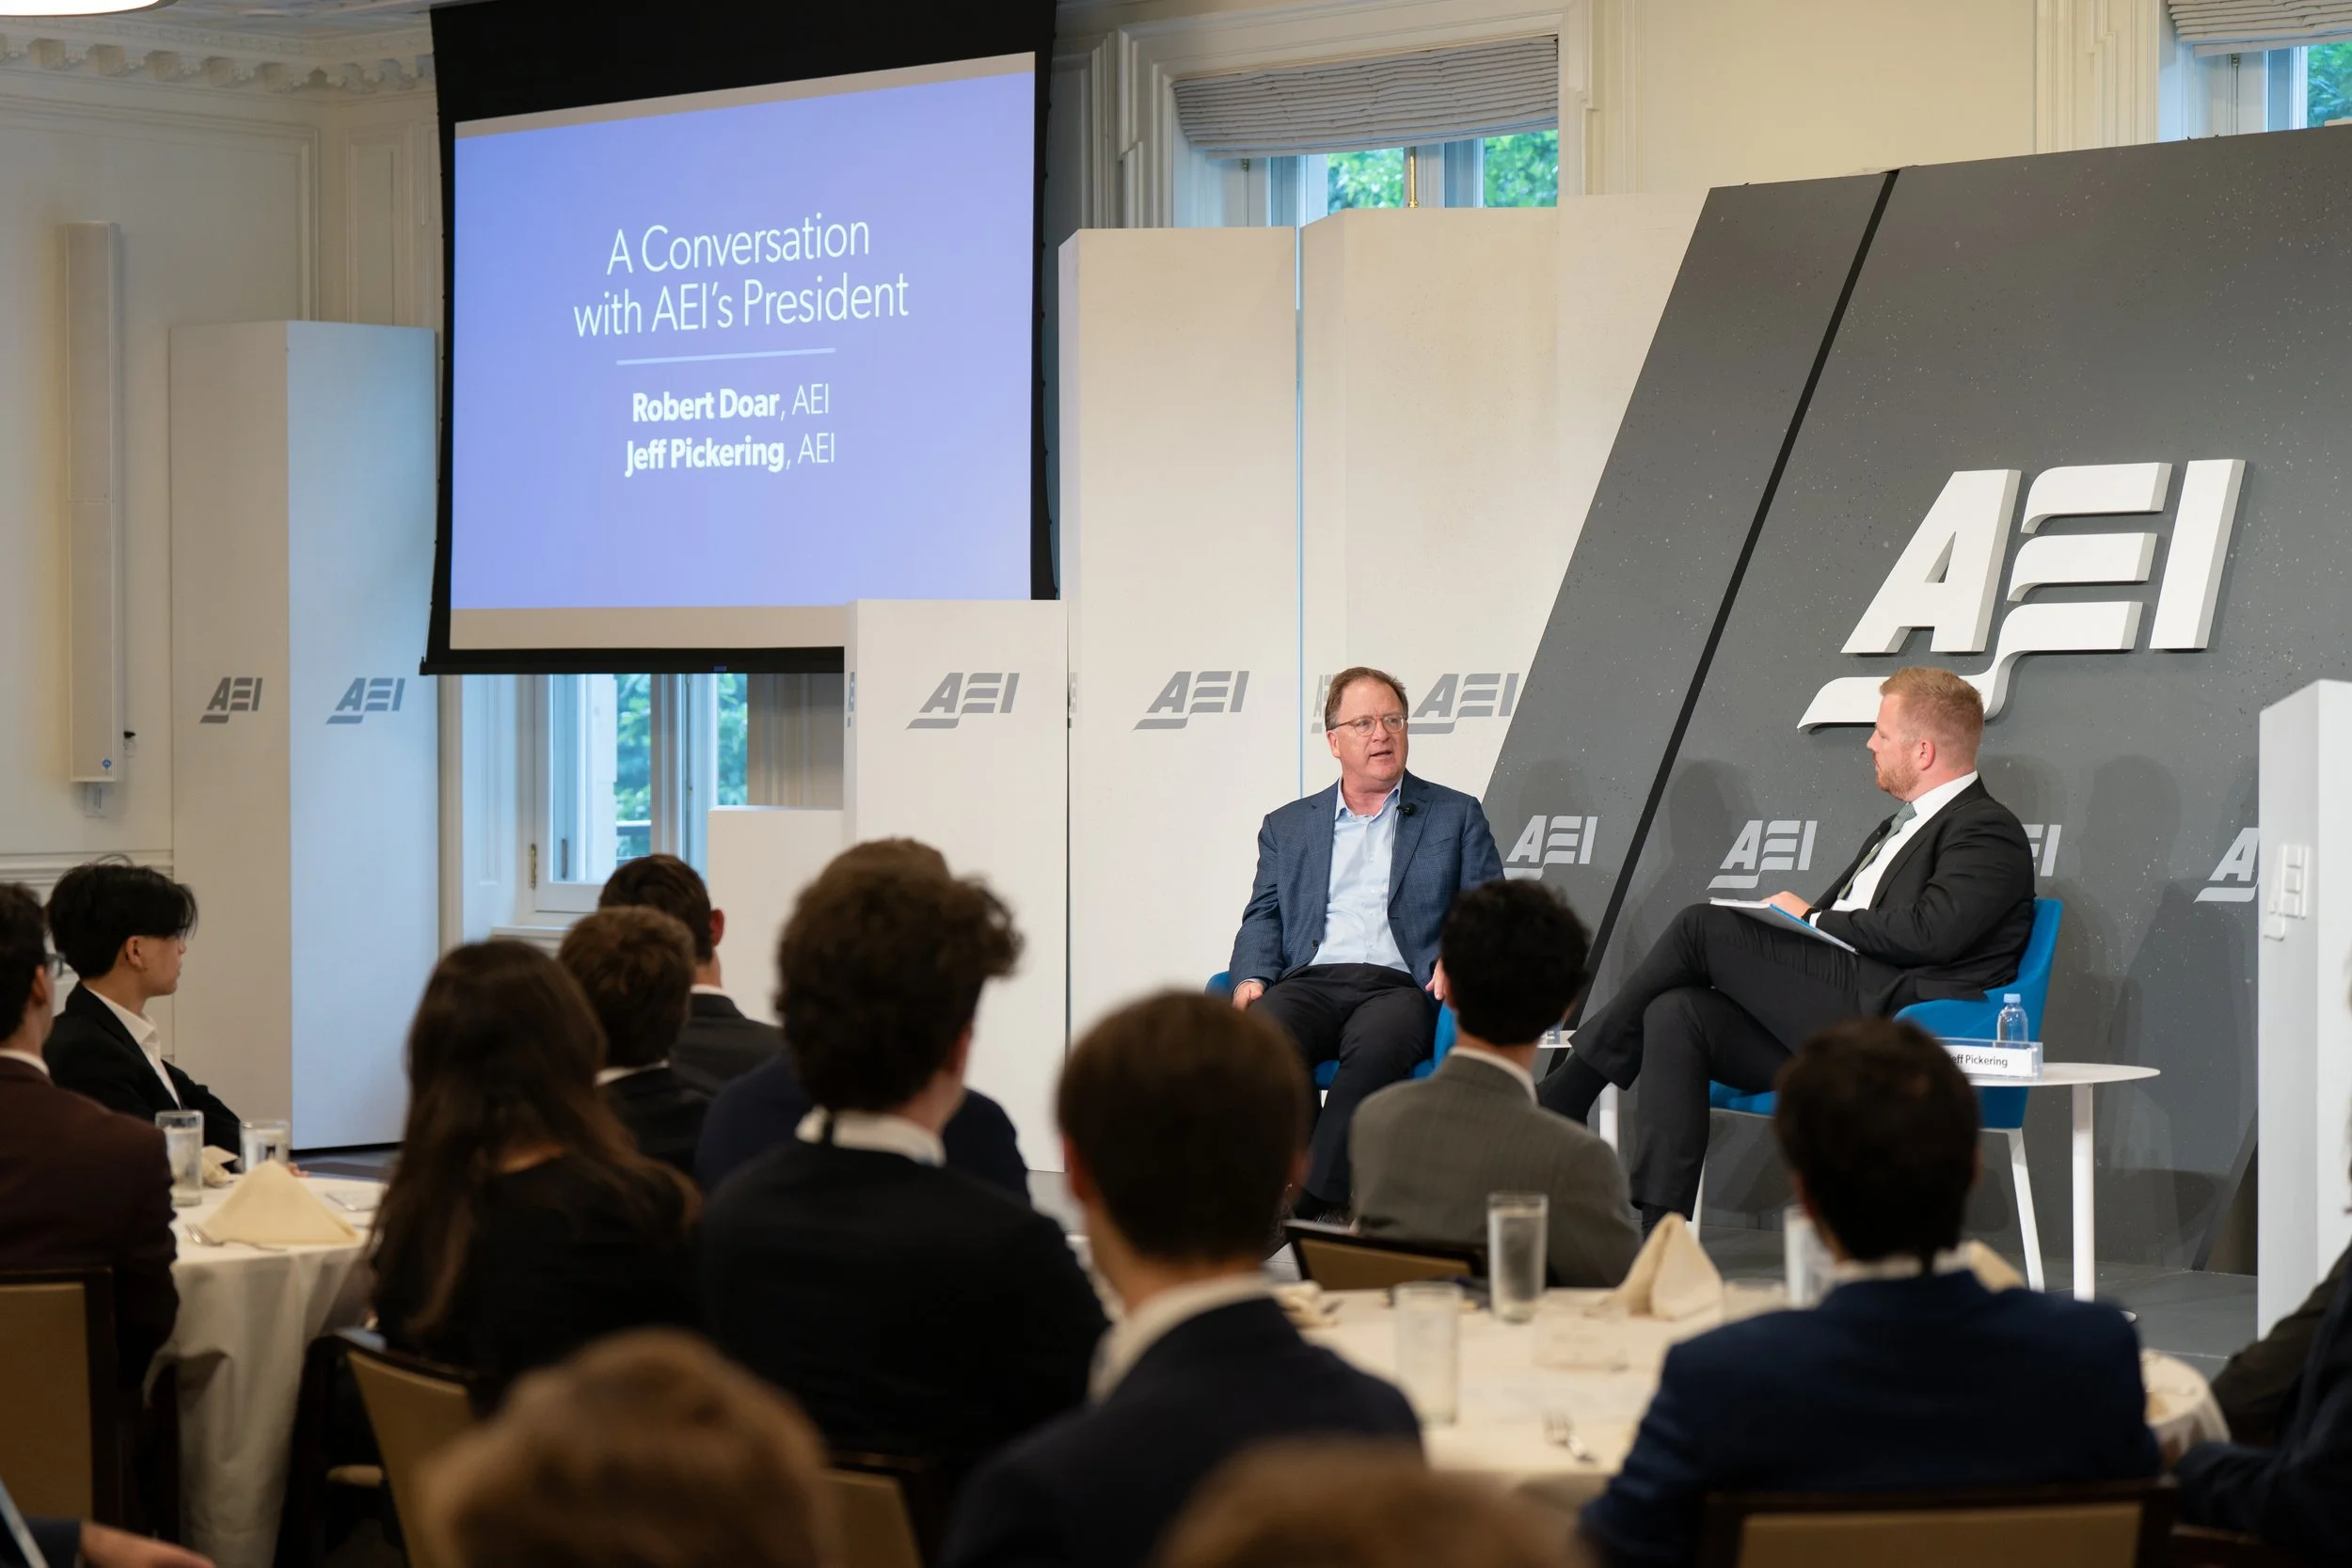
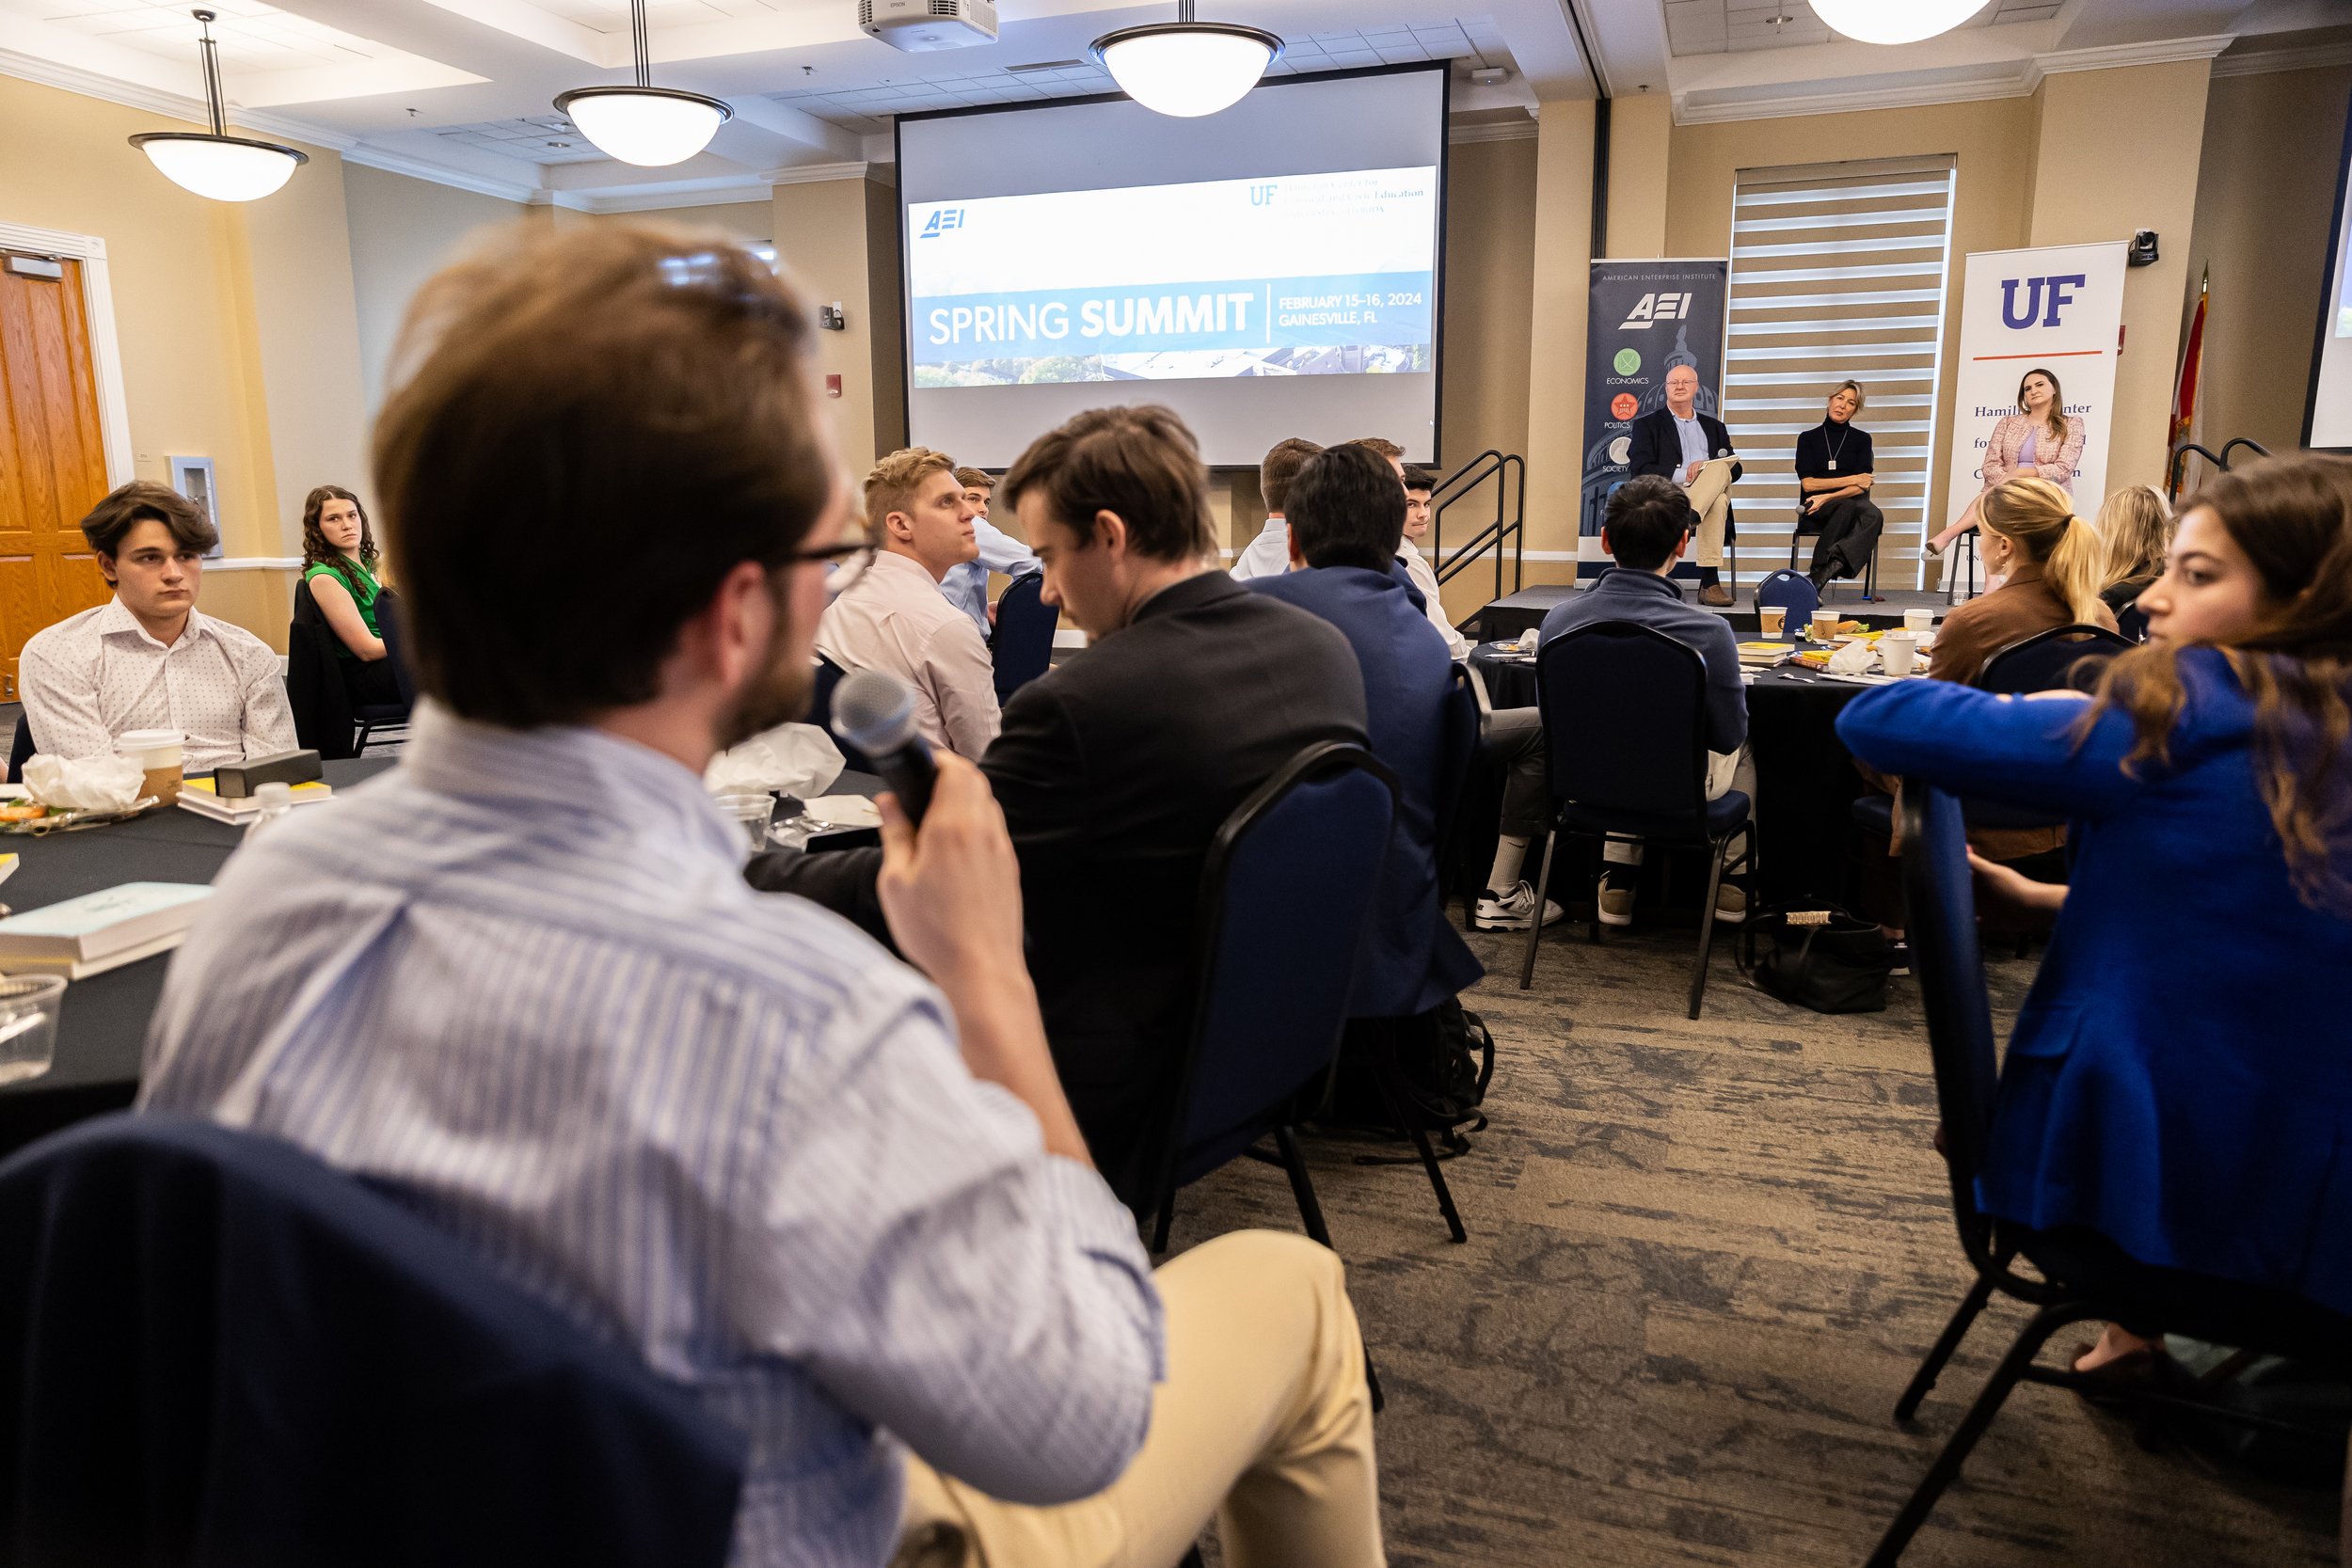
In my role as manager of Academic Programs at AEI, I handle faculty relations. This relationship-building culminated in our inaugural AEI Faculty Summit in January 2024. We had a little over 30 attendees and a wonderful lineup of speakers, including Chris Scalia, Sam Abrams, Max Eden, Jim Pethokoukis, Leon Aron, Adam White, Peter Berkowitz, and Jenna Storey. It was a great way to kick off 2024.